 Web Server Statistics for sarang.ca Web Server Statistics for sarang.ca
(Go To: Top: General Summary: Daily Summary: Hourly Summary: Domain Report: Organization Report: Operating System Report: Status Code Report: File Size Report: File Type Report: Directory Report: Request Report)
This report contains overall statistics.
Successful requests: 20,315
Average successful requests per day: 20,328
Successful requests for pages: 373
Average successful requests for pages per day: 372
Failed requests: 639
Redirected requests: 279
Distinct files requested: 15,257
Distinct hosts served: 4,641
Corrupt logfile lines: 163
Data transferred: 3.09 gigabytes
Average data transferred per day: 3.09 gigabytes
(Go To: Top: General Summary: Daily Summary: Hourly Summary: Domain Report: Organization Report: Operating System Report: Status Code Report: File Size Report: File Type Report: Directory Report: Request Report)
This report lists the total activity for each day of the week, summed over all the weeks in the report.
Each unit ( ) represents 10 requests
for pages or part thereof.
) represents 10 requests
for pages or part thereof.
day: #reqs: #pages: ---: -----: ------: Sun: 0: 0: Mon: 20311: 373:Tue: 4: 0: Wed: 0: 0: Thu: 0: 0: Fri: 0: 0: Sat: 0: 0:
(Go To: Top: General Summary: Daily Summary: Hourly Summary: Domain Report: Organization Report: Operating System Report: Status Code Report: File Size Report: File Type Report: Directory Report: Request Report)
This report lists the total activity for each hour of the day, summed over all the days in the report.
Each unit () represents 2 requests
for pages or part thereof.
hour: #reqs: #pages: ----: -----: ------: 0: 653: 26:16: 1058: 16:
19: 791: 3:
(Go To: Top: General Summary: Daily Summary: Hourly Summary: Domain Report: Organization Report: Operating System Report: Status Code Report: File Size Report: File Type Report: Directory Report: Request Report)
This report lists the countries of the computers which requested files.
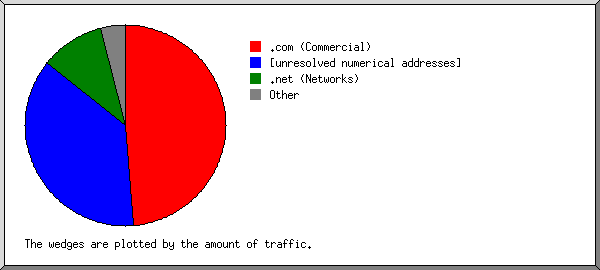
Listing domains, sorted by the amount of traffic.
#reqs: %bytes: domain
-----: ------: ------
11588: 48.63%: .com (Commercial)
 3366: 37.06%: [unresolved numerical addresses]
 4513: 10.33%: .net (Networks)
    2:  0.75%: .tr (Turkey)
   29:  0.61%: .ca (Canada)
  185:  0.54%: .au (Australia)
  577:  0.52%: [unknown domain]
    1:  0.50%: .pl (Poland)
    4:  0.47%: .mx (Mexico)
    7:  0.45%: .br (Brazil)
    1:  0.07%: .ar (Argentina)
    1:  0.02%: .de (Germany)
    1:  0.02%: .th (Thailand)
    1:  0.01%: .zw (Zimbabwe)
    1:  0.01%: .cl (Chile)
   27:       : [domain not given]
    7:       : .vn (Vietnam)
    1:       : .bo (Bolivia)
    1:       : .cn (China)
    1:       : .arpa (Arpanet)
    1:       : .info (Informational)
(Go To: Top: General Summary: Daily Summary: Hourly Summary: Domain Report: Organization Report: Operating System Report: Status Code Report: File Size Report: File Type Report: Directory Report: Request Report)
This report lists the organizations of the computers which requested files.
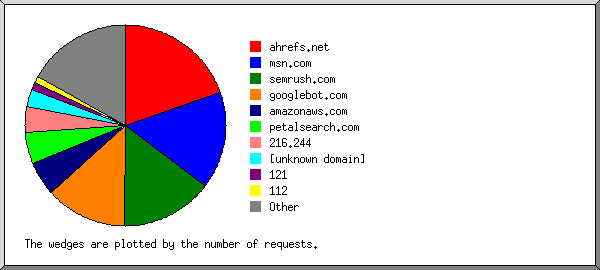
Listing the top 20 organizations by the number of requests, sorted by the number of requests.
#reqs: %bytes: organization
-----: ------: ------------
 4022:  4.69%: ahrefs.net
 3142: 20.22%: msn.com
 3019:  3.31%: semrush.com
 2636: 21.33%: googlebot.com
 1146:  0.80%: amazonaws.com
 1028:  0.01%: petalsearch.com
  853:  0.42%: 216.244
  577:  0.52%: [unknown domain]
  231:  0.05%: 121
  225:  0.61%: 112
  187:  2.32%: shawcable.net
  186:  2.44%: telus.net
  184:  0.15%: dodo.net.au
  175:  1.47%: google.com
  160:  0.03%: 118
  152:  0.21%: hwclouds-dns.com
  146: 30.82%: 216.73
  146:  0.05%: 116
  126:  0.04%: 211.235
  114:  0.02%: 58
 1860: 10.46%: [not listed: 193 organizations]
(Go To: Top: General Summary: Daily Summary: Hourly Summary: Domain Report: Organization Report: Operating System Report: Status Code Report: File Size Report: File Type Report: Directory Report: Request Report)
This report lists the operating systems used by visitors.
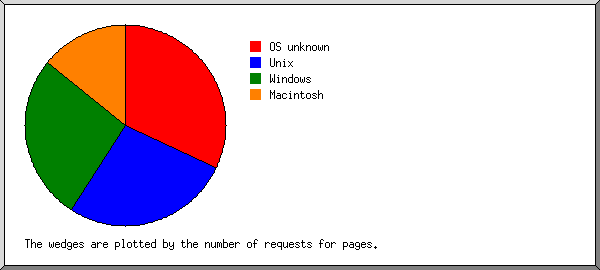
Listing operating systems, sorted by the number of requests for pages.
 #: #reqs: #pages: OS
--: -----: ------: --
 1:  8033:    119: OS unknown
 2:  4241:    101: Unix
  :  4237:    101:   Linux
  :     3:      0:   Other Unix
  :     1:      0:   BSD
 3:  1947:    100: Windows
  :  1738:     71:   Windows NT
  :   101:     27:   Unknown Windows
  :   100:      1:   Windows XP
  :     4:      1:   Windows ME
  :     1:      0:   Windows CE
  :     2:      0:   Windows 98
  :     1:      0:   Windows 2000
 4:   883:     53: Macintosh
 5:  5209:      0: Known robots
 6:     1:      0: OS/2
(Go To: Top: General Summary: Daily Summary: Hourly Summary: Domain Report: Organization Report: Operating System Report: Status Code Report: File Size Report: File Type Report: Directory Report: Request Report)
This report lists the HTTP status codes of all requests.
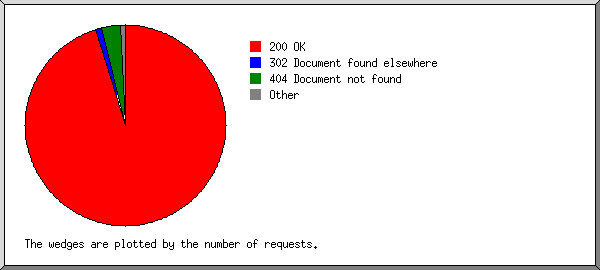
Listing status codes, sorted numerically.
#reqs: status code
-----: -----------
20210: 200 OK
   86: 206 Partial content
   54: 301 Document moved permanently
  225: 302 Document found elsewhere
   19: 304 Not modified since last retrieval
  639: 404 Document not found
(Go To: Top: General Summary: Daily Summary: Hourly Summary: Domain Report: Organization Report: Operating System Report: Status Code Report: File Size Report: File Type Report: Directory Report: Request Report)
This report lists the sizes of files.
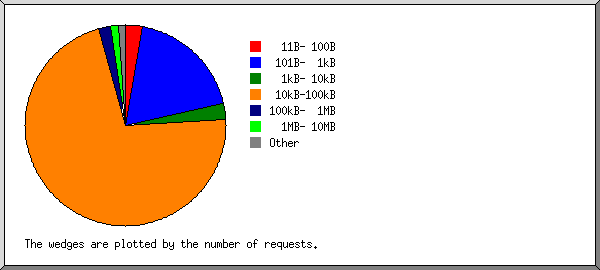
       size: #reqs: %bytes:
-----------: -----: ------:
          0:   127:       :
   1B-  10B:    15:       :
  11B- 100B:   559:       :
 101B-  1kB:  3831:  0.03%:
  1kB- 10kB:   522:  0.07%:
 10kB-100kB: 14536: 16.37%:
100kB-  1MB:   389:  6.53%:
  1MB- 10MB:   268: 28.12%:
 10MB-100MB:    68: 48.88%:
(Go To: Top: General Summary: Daily Summary: Hourly Summary: Domain Report: Organization Report: Operating System Report: Status Code Report: File Size Report: File Type Report: Directory Report: Request Report)
This report lists the extensions of files.
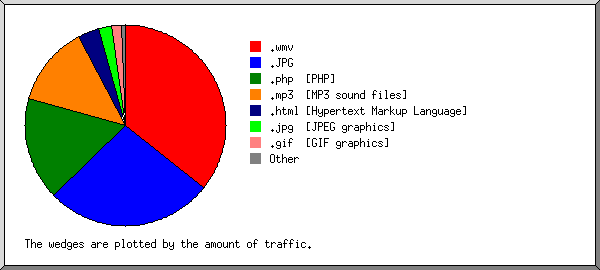
Listing extensions with at least 0.1% of the traffic, sorted by the amount of traffic.
#reqs: %bytes: extension
-----: ------: ---------
   64: 35.66%: .wmv
  486: 26.96%: .JPG
16718: 16.63%: .php  [PHP]
   15: 12.98%: .mp3  [MP3 sound files]
  163:  3.51%: .html [Hypertext Markup Language]
  251:  2.12%: .jpg  [JPEG graphics]
 1935:  1.62%: .gif  [GIF graphics]
    3:  0.23%: .MPG
  402:  0.22%: .js   [JavaScript code]
  278:  0.07%: [not listed: 5 extensions]
(Go To: Top: General Summary: Daily Summary: Hourly Summary: Domain Report: Organization Report: Operating System Report: Status Code Report: File Size Report: File Type Report: Directory Report: Request Report)
This report lists the directories from which files were requested. (The figures for each directory include all of its subdirectories.)
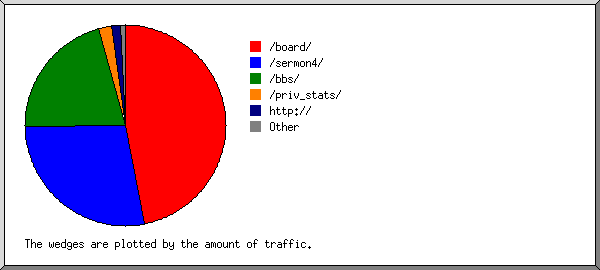
Listing directories with at least 0.01% of the traffic, sorted by the amount of traffic.
#reqs: %bytes: directory
-----: ------: ---------
19872: 46.88%: /board/
   34: 27.87%: /sermon4/
  140: 21.00%: /bbs/
  113:  2.04%: /priv_stats/
   88:  1.51%: http://
    5:  0.71%: /sarangphoto/
   63:       : [not listed: 4 directories]
(Go To: Top: General Summary: Daily Summary: Hourly Summary: Domain Report: Organization Report: Operating System Report: Status Code Report: File Size Report: File Type Report: Directory Report: Request Report)
This report lists the files on the site.
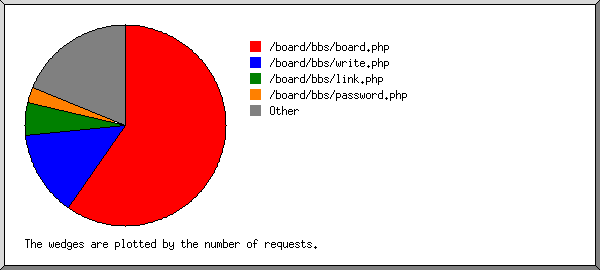
Listing files with at least 20 requests, sorted by the number of requests.
#reqs: %bytes:          last time: file
-----: ------: ------------------: ----
12113: 12.87%: Dec/16/25 12:00 AM: /board/bbs/board.php
   11:  0.01%: Dec/15/25 11:44 PM:   /board/bbs/board.php?bo_table=column
   10:  0.01%: Dec/15/25  6:40 PM:   /board/bbs/board.php?bo_table=column&wr_id=774
   10:  0.01%: Dec/15/25  5:20 PM:   /board/bbs/board.php?bo_table=ccm&wr_id=786
 2769:  2.38%: Dec/15/25 11:58 PM: /board/bbs/write.php
 1080:       : Dec/15/25 11:48 PM: /board/bbs/link.php
  501:  0.32%: Dec/15/25 11:54 PM: /board/bbs/password.php
  147:  0.09%: Dec/15/25 11:53 PM: /board/bbs/calendar.php
   51:  0.02%: Dec/15/25 11:51 PM: /board/js/common.js
   51:  0.05%: Dec/15/25 11:00 PM: /board/bbs/new.php
   50:       : Dec/15/25 11:41 PM: /
   50:  0.11%: Dec/15/25 11:33 PM: /board/js/jquery-1.4.2.min.js
   49:  0.01%: Dec/15/25 11:33 PM: /board/style.css
   49:  0.02%: Dec/15/25 11:33 PM: /board/js/sideview.js
   48:  0.02%: Dec/15/25 11:33 PM: /board/js/wrest.js
   47:       : Dec/15/25 11:33 PM: /board/js/ajax.js
   46:  0.01%: Dec/15/25 11:33 PM: /board/js/md5.js
   45:  0.01%: Dec/15/25 11:33 PM: /board/js/board.js
   44:       : Dec/15/25 11:33 PM: /board/js/capslock.js
   42:       : Dec/15/25 11:30 PM: /board/skin/outlogin/basic/img/login_top.gif
   41:  0.01%: Dec/15/25 11:30 PM: /board/img/sbcranch.jpg
   41:  0.02%: Dec/15/25 11:30 PM: /board/img/saranglogobg.gif
   41:       : Dec/15/25 11:30 PM: /board/img/search/_bar_04.gif
   41:       : Dec/15/25 11:30 PM: /board/skin/outlogin/basic/img/login_down.gif
   41:       : Dec/15/25 11:30 PM: /board/skin/outlogin/basic/img/login_button.gif
   41:       : Dec/15/25 11:30 PM: /board/skin/outlogin/basic/img/login_auto.gif
   40:       : Dec/15/25 11:30 PM: /board/skin/outlogin/basic/img/login_pw.gif
   40:       : Dec/15/25 11:30 PM: /board/skin/newcomment/rinix/img/basice1_09.gif
   40:       : Dec/15/25 11:30 PM: /board/skin/outlogin/basic/img/login_id.gif
   40:  0.02%: Dec/15/25 11:30 PM: /board/img/saranglogo.gif
   40:       : Dec/15/25 11:30 PM: /board/skin/newcomment/rinix/img/basice1_01.gif
   40:       : Dec/15/25 11:30 PM: /board/skin/newcomment/rinix/img/basice1_11.gif
   40:  0.09%: Dec/15/25 11:30 PM: /board/img/weekly_word.gif
   40:       : Dec/15/25 11:30 PM: /board/skin/newcomment/rinix/img/basice1_05.gif
   40:       : Dec/15/25 11:30 PM: /board/skin/outlogin/basic/img/login_pw_find_button.gif
   40:       : Dec/15/25 11:30 PM: /board/skin/newcomment/rinix/img/basice1_06.gif
   39:       : Dec/15/25 11:30 PM: /board/skin/board/basic/img/btn_list.gif
   39:       : Dec/15/25 11:30 PM: /board/skin/newcomment/rinix/img/basice1_10.gif
   39:       : Dec/15/25 11:30 PM: /board/skin/newcomment/rinix/img/basice1_02.gif
   39:  0.86%: Dec/15/25  6:37 AM: http://www.sarang.ca/priv_stats/usage_202505.html
   39:       : Dec/15/25 11:30 PM: /board/skin/newcomment/rinix/img/basice1_03.gif
   39:       : Dec/15/25 11:30 PM: /board/skin/newcomment/rinix/img/basice1_12.gif
   39:       : Dec/15/25 11:30 PM: /board/skin/newcomment/rinix/img/basice1_04.gif
   39:  0.82%: Dec/15/25 10:52 PM: /priv_stats/usage_202512.html
   39:       : Dec/15/25 11:30 PM: /board/skin/outlogin/basic/img/login_join_button.gif
   39:       : Dec/15/25 11:30 PM: /board/skin/newcomment/rinix/img/basice1_07.gif
   38:       : Dec/15/25 11:30 PM: /board/img/bg.gif
   38:       : Dec/15/25 11:30 PM: /board/img/bg2.gif
   38:  0.01%: Dec/15/25 11:30 PM: /board/img/hcrm360_200.gif
   38:       : Dec/15/25 11:30 PM: /board/skin/board/basic/img/title_bg.gif
   38:       : Dec/15/25 11:30 PM: /board/img/capslock.gif
   38:       : Dec/15/25 11:30 PM: /board/img/info.gif
   37:       : Dec/15/25 11:30 PM: /board/js/wrest.gif
   37:       : Dec/15/25 11:30 PM: /board/img/bg1.gif
   36:  0.01%: Dec/15/25 11:30 PM: /board/img/saranglogo2.gif
   36:       : Dec/15/25 11:30 PM: /board/skin/board/basic/img/view_dot.gif
   36:       : Dec/15/25 11:30 PM: /board/skin/board/basic/img/page_end.gif
   36:       : Dec/15/25 11:30 PM: /board/skin/board/basic/img/btn_trackback.gif
   35:       : Dec/15/25 11:30 PM: /board/skin/board/basic/img/icon_total.gif
   35:       : Dec/15/25 11:30 PM: /board/skin/board/basic/img/title_shadow.gif
   35:       : Dec/15/25 11:30 PM: /board/skin/board/basic/img/icon_view.gif
   35:       : Dec/15/25 11:30 PM: /board/skin/board/basic/img/icon_date.gif
   34:       : Dec/15/25 11:30 PM: /board/skin/board/basic/img/btn_search.gif
   32:  0.04%: Dec/15/25 11:58 PM: /board/
   30:       : Dec/15/25 11:30 PM: /board/skin/board/basic/img/page_next.gif
   27:       : Dec/15/25 10:05 PM: /board/skin/board/basic/img/icon_hot.gif
   25:       : Dec/15/25 10:05 PM: /board/skin/board/basic/img/icon_file.gif
   24:  0.53%: Dec/15/25  6:26 PM: /priv_stats/usage_202511.html
 1339: 81.66%: Dec/15/25 11:59 PM: [not listed: 798 files]
(Go To: Top: General Summary: Daily Summary: Hourly Summary: Domain Report: Organization Report: Operating System Report: Status Code Report: File Size Report: File Type Report: Directory Report: Request Report)


